Part 3
Source & Environment
Engineering Controls
| Alternative | Q (g/s) | H (m) | C (µg/m³) | % Reduction |
|---|---|---|---|---|
| Baseline | 2.00 | 10 | 268.3093 | — |
| Taller Stack | 2.00 | 20 | 143.9976 | 46.3% |
| Carbon Filter | 0.50 | 10 | 67.0773 | 75.0% |
| Electric Heat Pump | 0.20 | 10 | 26.8309 | 90.0% |
| Alternative | Cost Category | ROM Range | Source |
|---|---|---|---|
| Taller Stack (20 m) | Steel stack fabrication & erection | $30k–$80k | EPA Air Pollution Cost Manual, §2 |
| Foundation & structural reinforcement | $10k–$30k | RSMeans Heavy Construction 2024 | |
| Permitting & air modeling | $5k–$15k | State AQ permit fee schedules | |
| Annual inspection & maintenance | $2k–$5k/yr | EPA O&M guidance | |
| Activated Carbon Filter | Adsorption vessel & carbon bed | $50k–$150k | EPA Cost Manual, §3.1 (carbon adsorbers) |
| Ductwork & fan retrofit | $15k–$40k | RSMeans Mechanical 2024 | |
| Carbon replacement (annual) | $10k–$30k/yr | Vendor quotes (Calgon, Jacobi) | |
| Permitting & compliance testing | $5k–$15k | State AQ permit fee schedules | |
| Electric Heat Pump | Industrial heat pump unit | $150k–$400k | IEA Annex 35, Industrial Heat Pumps (2023) |
| Electrical infrastructure upgrade | $30k–$80k | Utility interconnection cost data | |
| Integration & controls engineering | $20k–$50k | DOE Better Plants case studies | |
| Annual electricity & maintenance | $8k–$20k/yr | DOE CHP/heat pump fact sheets |
Taller Stack (20 m)
Total ROM: $50k–$130k + $2k–$5k/yr
Simplest option. Requires structural engineering review (~2–4 months). May trigger New Source Review if stack modification is classified as a physical change. Does not reduce total mass emitted — only dilutes ground-level concentration.
Activated Carbon Filter
Total ROM: $70k–$205k + $10k–$30k/yr
Proven VOC/odor technology. Carbon bed sizing depends on exhaust flow rate and contaminant loading — pilot testing recommended (add 2–3 months). Spent carbon disposal must comply with RCRA if contaminants are hazardous. Pressure drop increases fan energy cost ~5–10%.
Electric Heat Pump
Total ROM: $200k–$530k + $8k–$20k/yr
Eliminates combustion emissions entirely — highest reduction but highest capital cost. Requires adequate electrical capacity (may need utility upgrade, 6–12 month lead time). Dependent on grid carbon intensity for net CO₂ benefit. Operational staff retraining needed. May qualify for IRA §48C tax credits (up to 30%).
| Alternative | Technical | Cost | Public | Environmental | Score |
|---|---|---|---|---|---|
| Taller Stack | 2 | 4 | 3 | 3 | 2.94 |
| Carbon Filter | 4 | 3 | 4 | 4 | 3.76 |
| Electric Heat Pump | 5 | 2 | 5 | 5 | 4.29 |
Recommended:
Highest weighted score of 4.29/5 based on your criteria weights.
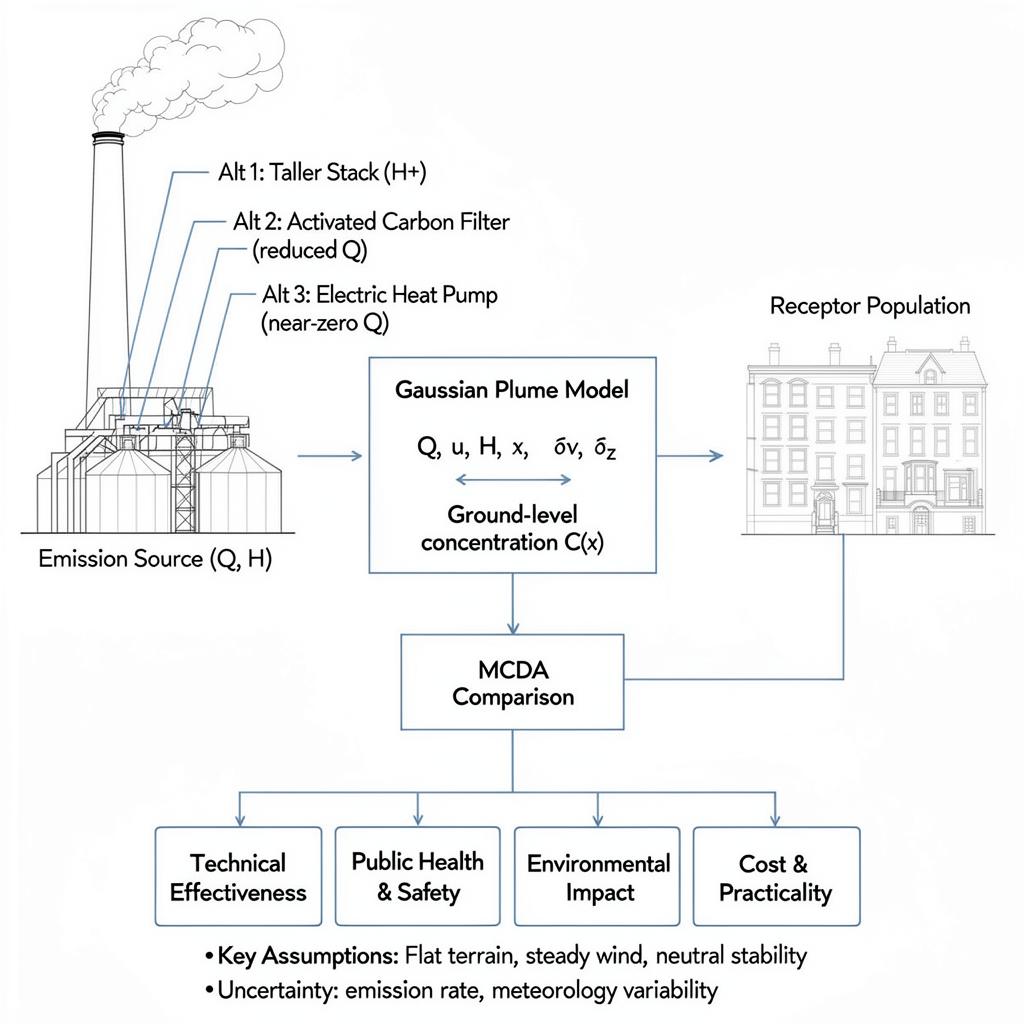
At 500 m downwind with a wind speed of 3 m/s, the baseline configuration (Q=2.00 g/s, H=10 m) produces a ground-level concentration of 268.3093 µg/m³.
Among the alternatives evaluated, Taller Stack reduces concentrations by 46.3%, Carbon Filter reduces concentrations by 75.0%, and Electric Heat Pump reduces concentrations by 90.0%.
Electric Heat Pump achieves the greatest reduction at 90.0%, yielding a concentration of 26.8309 µg/m³. Electrification eliminates combustion emissions at the source, providing the most comprehensive reduction in pollutant output.
Tradeoffs: The taller stack is a low-cost passive measure but does not reduce total emissions. Activated carbon filtration removes pollutants at the source with moderate operating cost. The electric heat pump eliminates combustion emissions entirely but requires significant capital investment and electrical infrastructure upgrades.
Consider the MCDA scores above — adjust the criteria weights to reflect your project priorities (e.g., weigh cost higher for budget-constrained projects or health higher for sensitive receptor areas).
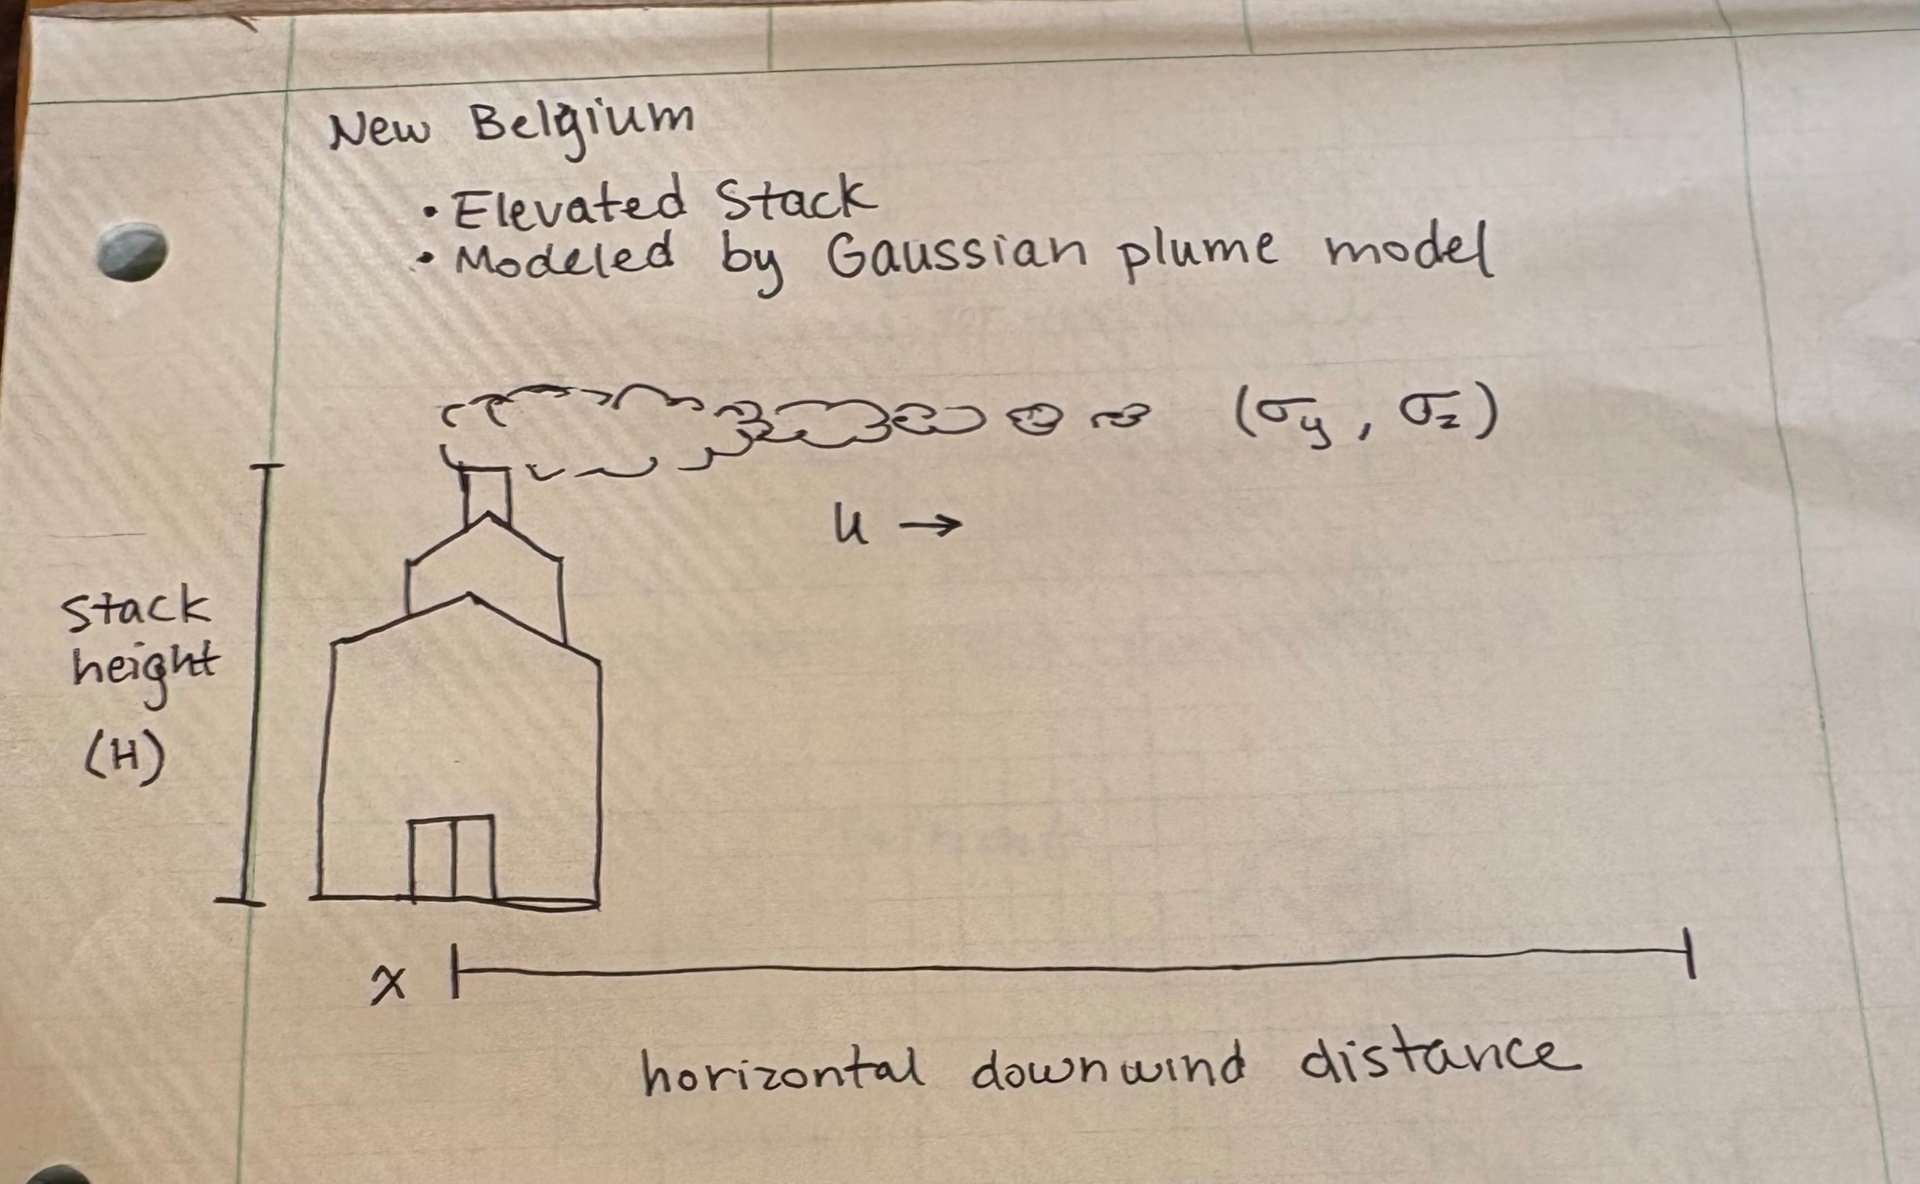
- Steady-state meteorological conditions
- Flat terrain (no topographic effects)
- Constant wind speed and direction
- Pasquill-Gifford stability class D (neutral)
- Ground-level receptor on plume centerline (y = 0, z = 0)
- No chemical transformation or deposition
- Simplified dispersion coefficients (σ_y, σ_z)
About This Tool
This interactive tool models air pollutant dispersion from a point source (brewery exhaust stack) using a simplified Gaussian plume equation. It accepts user-defined inputs including emission rate, wind speed, stack height, and receptor distance. The Gaussian model is appropriate for this scenario because it provides a well-validated, analytically tractable estimate of ground-level pollutant concentrations under steady-state meteorological conditions over flat terrain. The outputs — ground-level concentration values and percentage reductions — indicate how effectively each engineering alternative reduces pollutant exposure at downwind receptor locations. Lower concentrations correspond to reduced health risk for nearby residents. Results should be interpreted comparatively across alternatives rather than as absolute regulatory compliance values.
Part 4: Reflection
Design Defense
Based on this tool, I would defend the Electric Heat Pump upgrade. While the tool offers an MCDA with toggles, I choose values of 4, 3, 5, 5 for Technical Effectiveness, Cost & Practicality, Public Health & Safety and Environmental Impact respectively. The reason for this is because the goal of the alternatives is to reduce air pollution for the betterment of public and environmental health. If these criteria didn't prevail, the reason for spending time and money on a design would be sullied in my opinion. However, I like that the MCDA can be toggled because the different companies or contractors implementing the changes may have different priorities and can use the tool to assess which design best supports their goals and ethics. Regardless, the design choice I would defend with respect to the MCDA scores, ROM, and graph display on the tool, would be the Electric Heat Pump. While it has a high CAPEX, emissions are greatly reduced and downwind concentrations are reduced by the largest percentage when alternatives are compared to the baseline, making it highly attractive for public health and safety.
What Could Make Me Wrong
My comparison breaks down by relying heavily on assumptions that don't derive from specific datasets that relate to the unique scenario. What could make me wrong is the fact that I don't know what datasets the tool is pulling from. While attractive numbers are reported, they are difficult to validate because New Belgium does not publish public datasets. Also, it is hard to quantify feasibility and technical effectiveness of these solutions, and even if the estimates are backed, implementation in the real world could greatly alter these categories. Information needed to be more confident about this tool includes having daily emissions data that spans annually, or across production ebbs and flows. Also, having ground-level sensor data around the brewery and within a one mile radius could verify data pulled for baseline data.
Role of AI
AI helped me to build and edit my tool. I revised it through vibe coding to make the layout clear and content consistent with the project assignment. I intervened when logic patterns didn't match my personal understanding of the subject and the context of the scenario. For example, the tool wanted to report the effect of ground level pollutants over three miles away from the source, where pollutant concentrations were negligible. A search on Google Maps confirmed that many housing developments are within a one mile radius of the brewery. I confined my downwind distance to 2000 m. With the help of AI, I brainstormed possible solutions, and ultimately added three in which I was curious about their impact. The electric heat pump was included because I know research is being done at CSU to equip New Belgium with more sustainable operations processes that reduce source emissions and pollutants. I paired the AI tool, generated image and metrics with my personal understanding of the scenario to infuse my comments and reflections throughout the interface.